Case study · PhD in Physics · NTU · 2009–2014
Engineering a nanovolt measurement system, and discovering a hidden superconducting surface.
This case study in four parts
High-temperature superconductors carry electricity with zero resistance, but no one fully understands why. One open question is how "stripes" affect them. Stripes are patterns in which electrons arrange themselves inside the crystal. Answering it needed measurements more sensitive than standard lab equipment could deliver.
Go to part 1 ↓ 2The materialSingle crystals of La2−xBaxCuO4 (LBCO), the copper-oxide superconductor where stripes are strongest. Near a hole density of 1/8 its bulk Tc collapses, which makes it the place to test whether stripes help or hurt.
Go to part 2 ↓ 3The system I builtI designed and built two dipper cryostats with noise below ±3 nanovolts, for fields up to 16 tesla, and automated them in LabVIEW. I also helped set up a second technique, a tunnel-diode oscillator, for measuring magnetic penetration depth.
Go to part 3 ↓ 4The resultI separated the signal from a crystal's surface from the signal from its interior. That showed the surface becomes superconducting at a temperature up to 64% higher than the bulk. Earlier measurements had not detected this. The work became a first-author paper and a patent co-owned by NTU and Japan's national research institute AIST.
Go to part 4 ↓1.1 · The question
Do stripes help superconductivity, or kill it?
In copper-oxide superconductors, electrons can organise themselves into stripes. Where the stripes are pinned in place, bulk superconductivity collapses. Where they fluctuate, they appear to help electrons pair. Which effect wins was one of the central questions in the field, and the crystal where stripes are strongest, LBCO near a hole density of 1/8, was the place to ask it.
Answering it meant measuring how charge and heat flow through a crystal 3 mm long as temperature and magnetic field change: resistivity, thermopower and the Nernst effect, which is especially sensitive to superconducting fluctuations above Tc. The signals are nanovolt-level. Standard lab equipment could not resolve them, so the test system had to be built first.
- Signalnanovolt-level, resolved to ±3 nV
- Temperature5 – 300 K
- Magnetic fieldup to 16 T
- Measurementsresistivity, thermopower, Nernst
- Samplessingle crystals, about 3 mm long
2.1 · The material
Why stripes, and why the number 1/8.
The crystals I measured, and the physics that decides what signal to expect.
Superconductivity from a Mott insulator. In conventional superconductors, BCS theory explains everything: lattice vibrations bind electrons into Cooper pairs, which condense into one quantum state separated from excitations by an energy gap Δ. Copper oxides break that picture. The parent compound La2CuO4 is an antiferromagnetic Mott insulator, an insulator because of strong electron repulsion rather than band filling. Replacing some La3+ with Ba2+ or Sr2+ removes electrons from the CuO2 planes. At a hole density around 0.05 the material becomes a superconductor, with Tc far above anything phonons can explain.
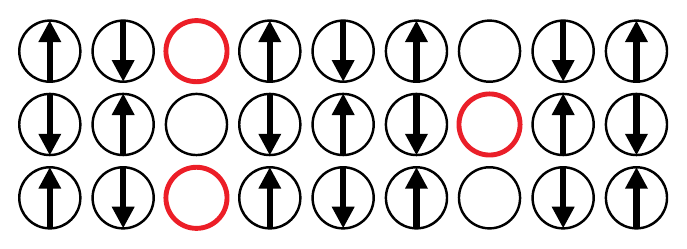
Stripes. The doped holes do not spread out evenly. They can line up in one-dimensional rivers of charge, with antiferromagnetic domains between them whose spin pattern flips by π across each river. At a hole density of p = 1/8 the rivers sit four lattice spacings apart. In La2−xBaxCuO4, a low-temperature tetragonal (LTT) lattice distortion pins the stripes in place.
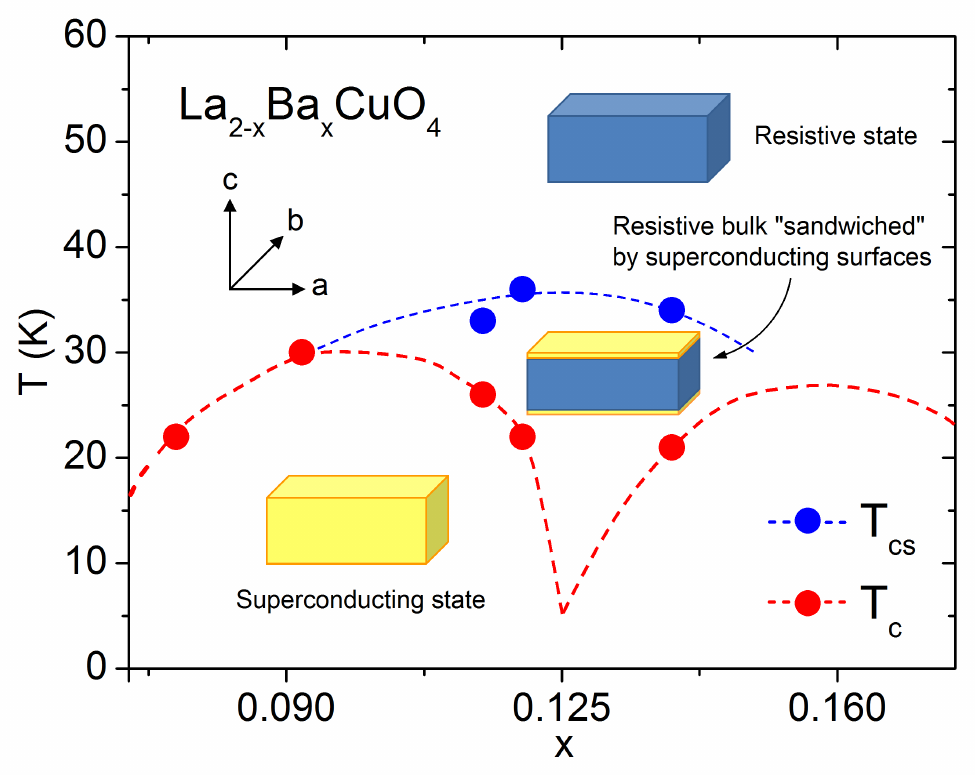
The 1/8 anomaly. Pinned stripes tie up carriers and break phase coherence between them, so bulk Tc in LBCO collapses from about 30 K to below 5 K right at x = 1/8. Yet fluctuating stripes appear to help pairing elsewhere: in several cuprate families Tc rises as stripes move closer together. Whether stripes help or hurt superconductivity was, and remains, one of the central questions in the field. LBCO, where stripes are strongest, is the natural place to ask it.
3.1 · The instrument
Designing out every source of noise.
The signals I needed are at nanovolt level across a crystal 3 mm long, and had to be resolved to ±3 nV. At that scale, ordinary things become noise. That includes a soldered joint between two different metals, a stray radio signal, or a faint draught of gas warming one end of the sample.
I built the test system around two homebuilt dipper cryostats: probes lowered straight into liquid helium, each with a vacuum can around the sample and a helium pot that reaches about 2 K when pumped. The Nernst probe goes inside a 16 T superconducting magnet. The zero-field probe fits standard helium storage dewars, which uses less helium for measurements that need no magnetic field. I designed both in SolidWorks, produced the machining drawings, and assembled and wired them by hand. The Nernst probe went through four design generations between 2011 and 2014.
These choices kept the noise down:
• Twisted-pair copper leads, about 1 twist per mm, to reject radio-frequency pickup.
• Leads clamped instead of soldered at room temperature, which avoids thermal voltages, plus a shielded "nanovolt connector box" I designed.
• Every wire heat-sunk at several stages, finishing on beryllium-oxide chips held at the sample temperature.
• A thin copper radiation shield and high vacuum around the sample.
• A G10 thermal link and a low-mass stage, so the sample could be heated to 300 K without boiling off helium.
• Differential readings (signal on minus signal off) to cancel any remaining offset.
- Temperature range5 – 300 K
- Voltage noise< ±3 nV
- Magnetic fieldup to 16 T
- Sample-space vacuum< 1×10⁻⁶ mbar
- Measurementsresistivity, thermopower, Nernst
- CryostatHomebuilt dipper, pumped 2 K pot
- AutomationLabVIEW, 40+ versions
3.2 · Measurement automation
One LabVIEW program runs the whole test system.
I wrote the control software for the dipper cryostats and grew it with them, through more than 40 versions. The last one, Thermopower and Nernst 4.16 (2014), runs eight instruments from a single front panel and steps through temperature, field and heater current unattended.
3.3 · Proving it works
Validated before trusted.
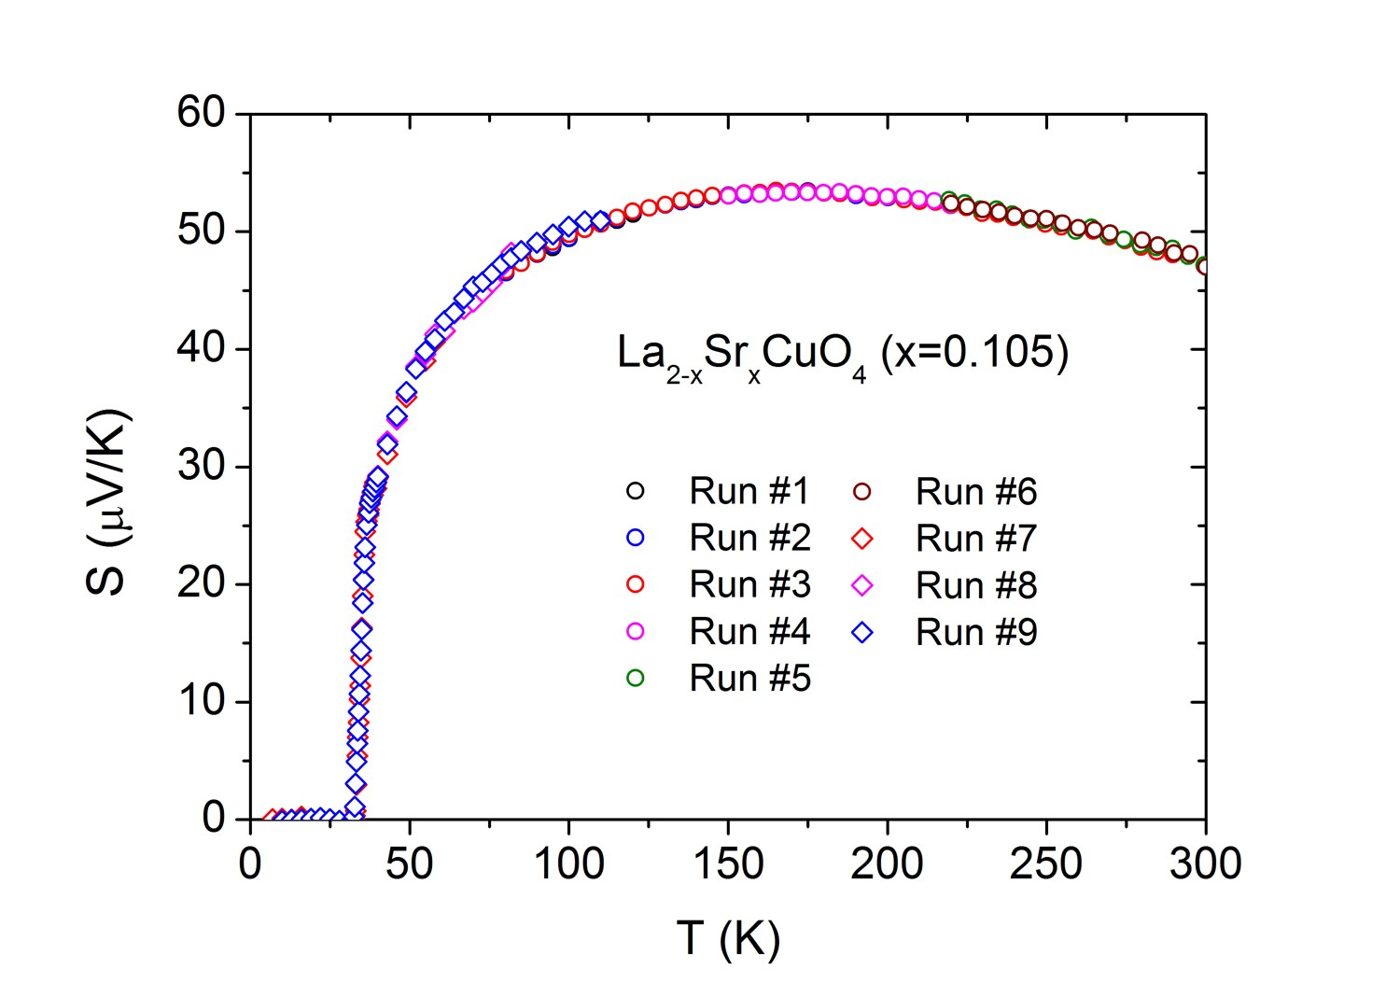
Before using the probes on new material, I tested them on a well-characterised reference crystal of La2−xSrxCuO4. Its resistivity and thermopower gave the same superconducting transition in both measurements. The results also matched data published by other groups.
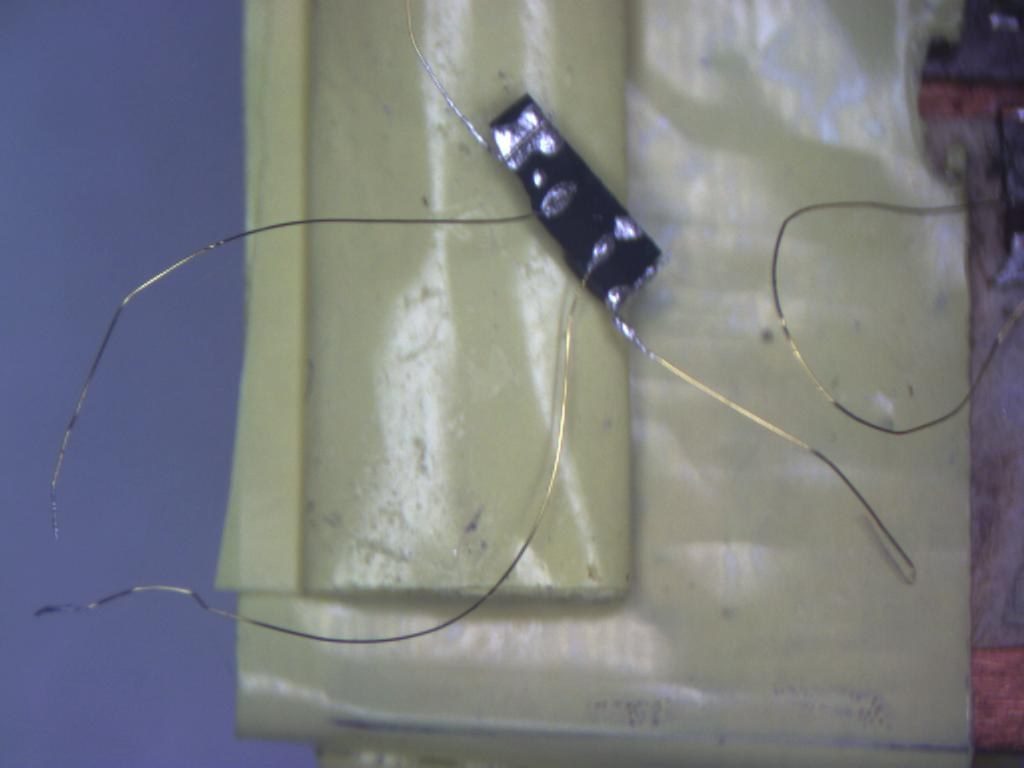
I also made the thermocouples that measure temperature differences across the sample. I spot-welded wires 25 µm thick, then checked each joint electrically in liquid nitrogen. Repeated runs lay on top of each other, which is the kind of evidence you want before believing a surprising result.
3.4 · A second technique
Starting the lab's RF oscillator setup.
A tunnel-diode oscillator (TDO) senses a material's magnetic response as a tiny shift in a radio frequency. Optimised setups reach parts-per-billion precision. Few labs run one, and the lab wanted its own for future work down to millikelvin temperatures.
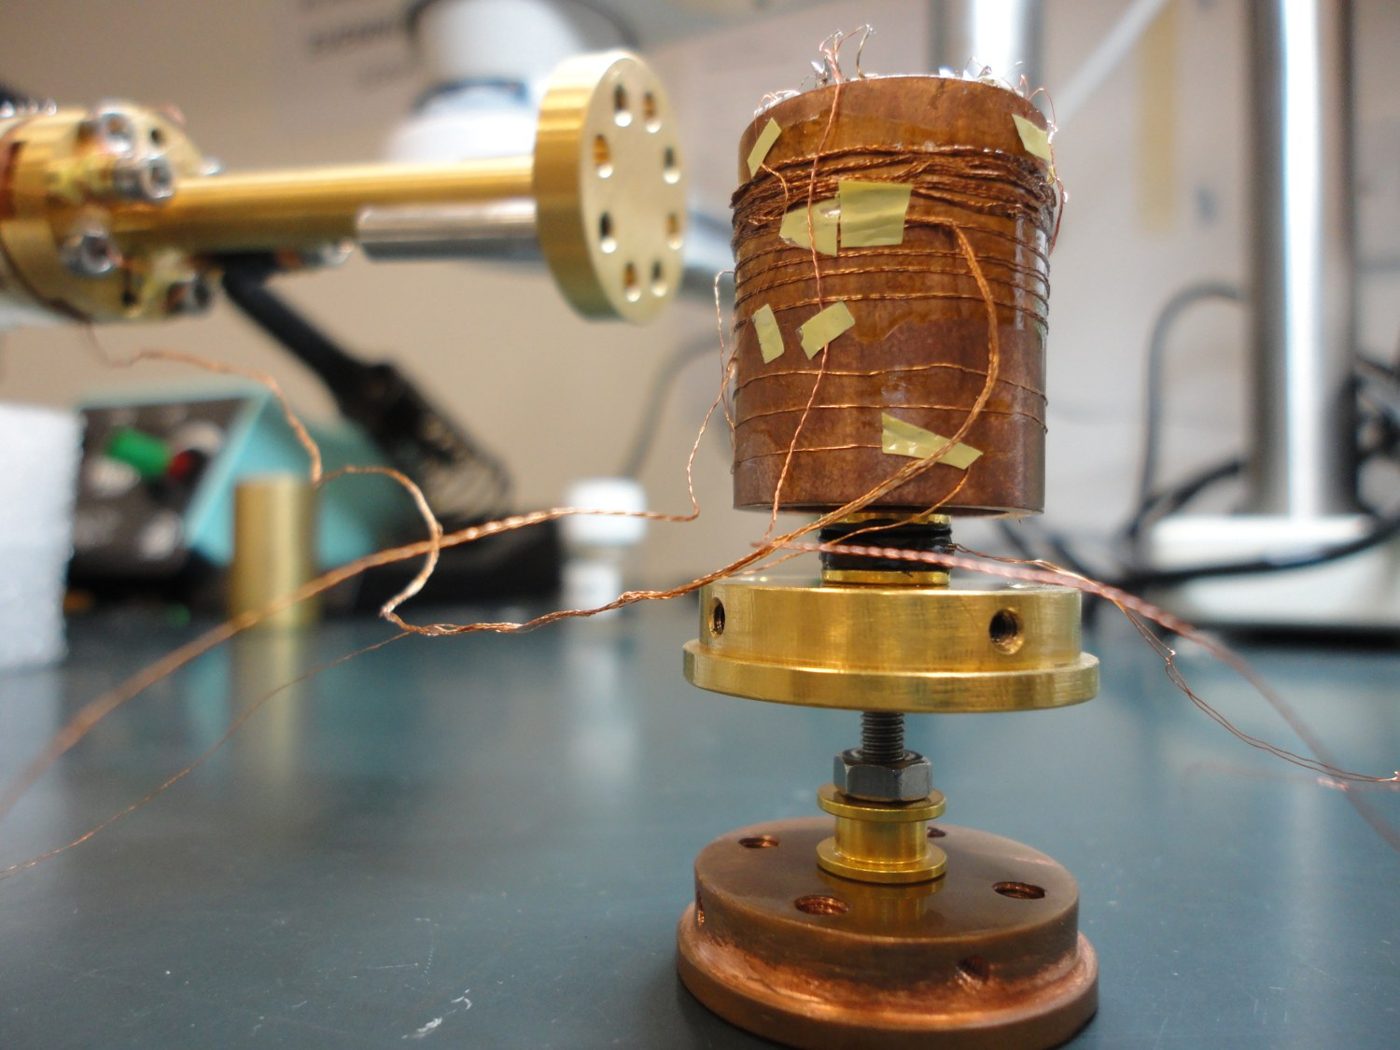
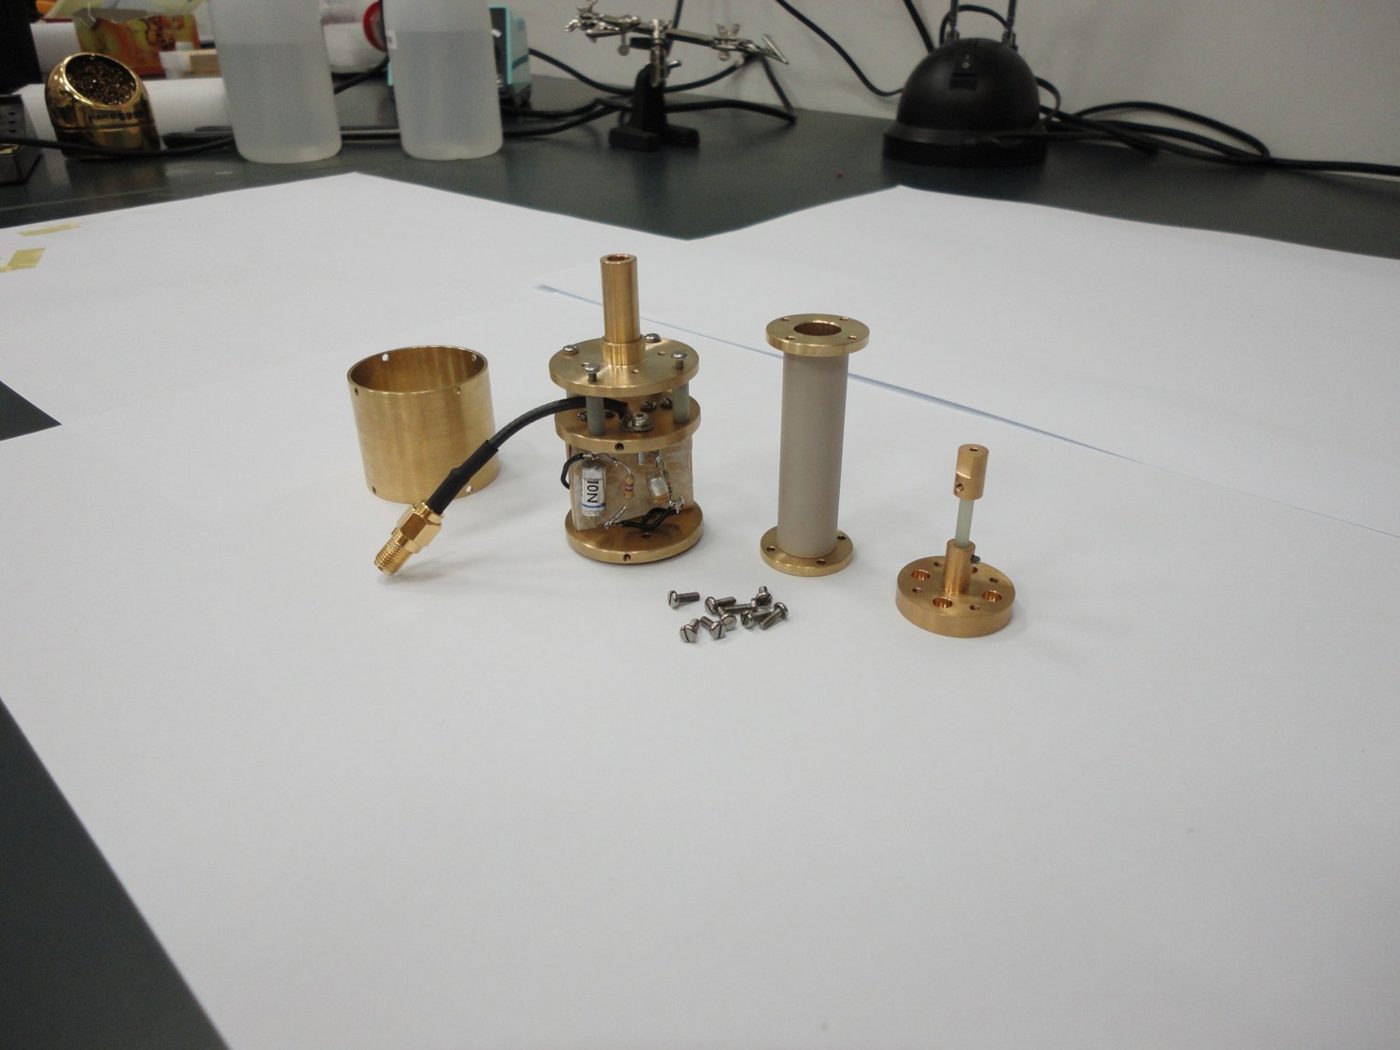
I designed and built the low-temperature TDO cell, which holds the sample on a sapphire rod inside a hand-wound coil without touching it. I signed 12 machining drawings for it, did the circuit analysis and impedance matching, and built the coil winder. I planned the project with an undergraduate final-year student, who built the 77 K test probe, wrote the control software and improved the RF shielding. The room-temperature electronics reached part-per-million frequency stability in 2011, and the oscillator first resonated at about 21 MHz in liquid nitrogen. Making it stable at low temperature was still open when I finished, so I wrote the specification for the helium-3 cryostat it would move into and handed the groundwork to the next student.
To learn what precision the new instrument would need, I analysed existing penetration-depth data on the superconductor LaOs4Sb12, which had been measured at the University of Illinois. At low temperature the penetration depth rose exponentially, the signature of a fully gapped s-wave superconductor, but a single BCS gap fitted only below 0.3 Tc and came out well under the BCS value. I modelled the superfluid density ρs(T) = λ²(0)/λ²(T) as a weighted sum of two s-wave gaps, each with its own temperature dependence, and that fitted the whole temperature range. So LaOs4Sb12 has two superconducting gaps, a result that bears on the unusual pairing in its sister compound PrOs4Sb12. That became my first first-author paper, Phys. Rev. B 86, 064518 (2012).
Specialties behind this system
Go deeper into the expertise this work draws on.
Test automation
Instruments, sequencing and data in one programThe LabVIEW program behind these cryostats, alongside my lock-in system and production prober software.Active thermal control
Closed-loop temperature control from 300 K to 2 KHow the dipper cryostats held and stepped temperature: heat paths, thermometry, PID loops and thermal debug.Vacuum
High vacuum in the cryostats I builtMy vacuum-can drawing, the pumped sample space and the 2 K helium pot.4.1 · Results at a glance
What came out of it.
The test system did its job: it resolved signals no standard equipment could, and proved itself on a reference crystal first. That is why the surprising result, a superconducting surface hidden above a resistive bulk, could be trusted, published and patented.
- Discoverysurface superconducting up to 64% above bulk Tc
- Instrumentnoise below ±3 nV · 5–300 K · up to 16 T
- Validationrepeat runs overlapping on a reference crystal
- Publicationfirst-author paper
- Patentgranted, SG 11201510509W, NTU and AIST
4.2 · The discovery
The surface and the inside behave differently.
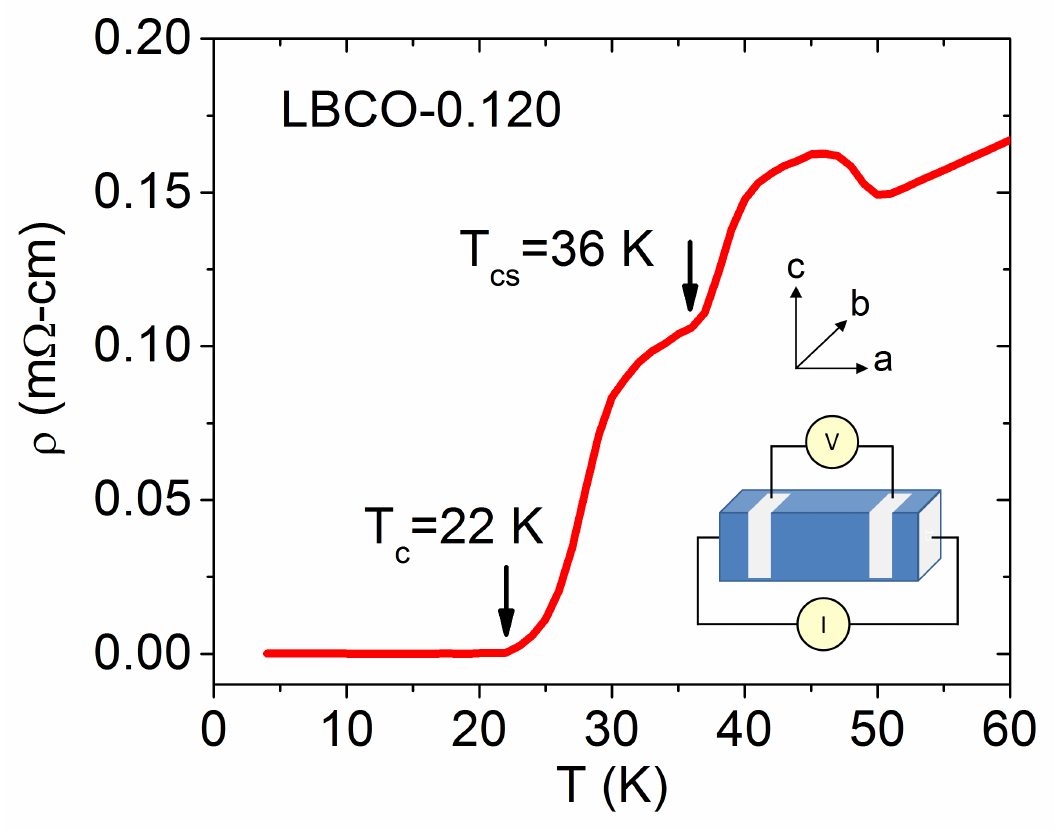
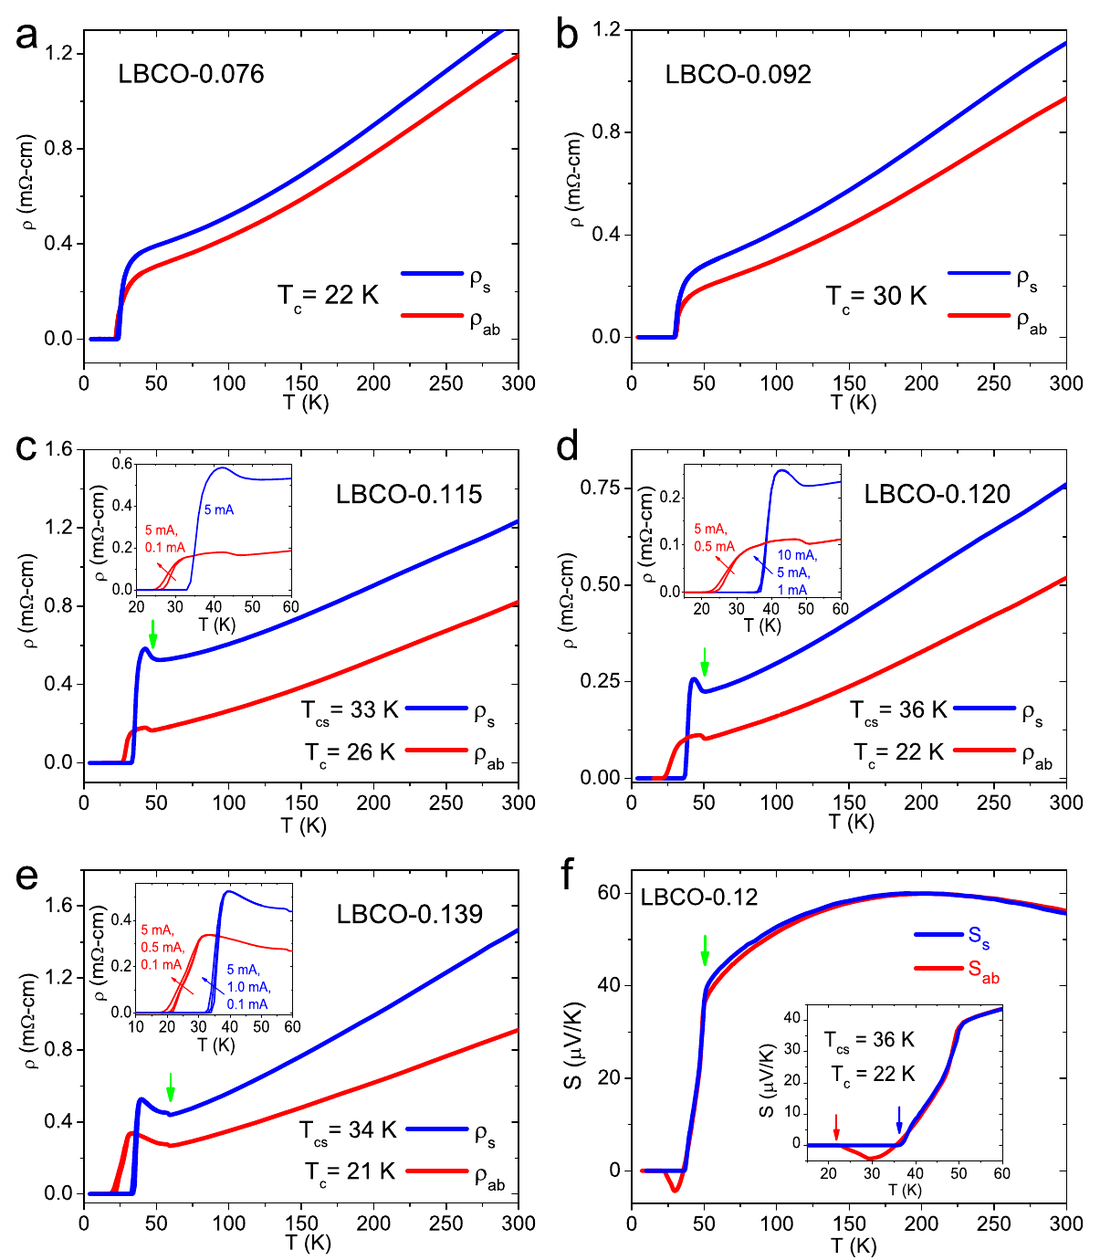
These materials are made of layers stacked like pages in a book. If you put the voltage contacts on the top face, you mostly sense the few layers at the surface. If you put them on the side, you average over the whole interior. I measured the same crystals both ways, across a range of compositions of La2−xBaxCuO4 grown at AIST in Japan.
The surface superconducting transition at composition x = 0.12. That is up to 64% above the bulk value, and higher than the best bulk value reported for this material at any composition. The effect coincided with the compositions where stripe order is present.
To make sure this wasn't an artefact, I checked it in several independent ways. I used magnetisation measurements, mapped resistance across the sample, and built a resistor-network model of a superconducting surface layer on a normal interior. I also tested and ruled out other explanations. Earlier transport studies hadn't reported it. The most likely reason is where their contacts were placed: covering both the top and the sides blurs the two signals together.
I followed up with high-resolution Nernst-effect measurements on the x = 0.12 crystal. They showed unusual features linked to the stripe phase, including a signal at zero magnetic field.
Published as: X. Y. Tee et al., "Two superconducting transitions in single crystal La2−xBaxCuO4," Phys. Rev. B 95, 054516 (2017).
4.3 · Making sense of it
Is the surface really a separate, two-dimensional superconductor?
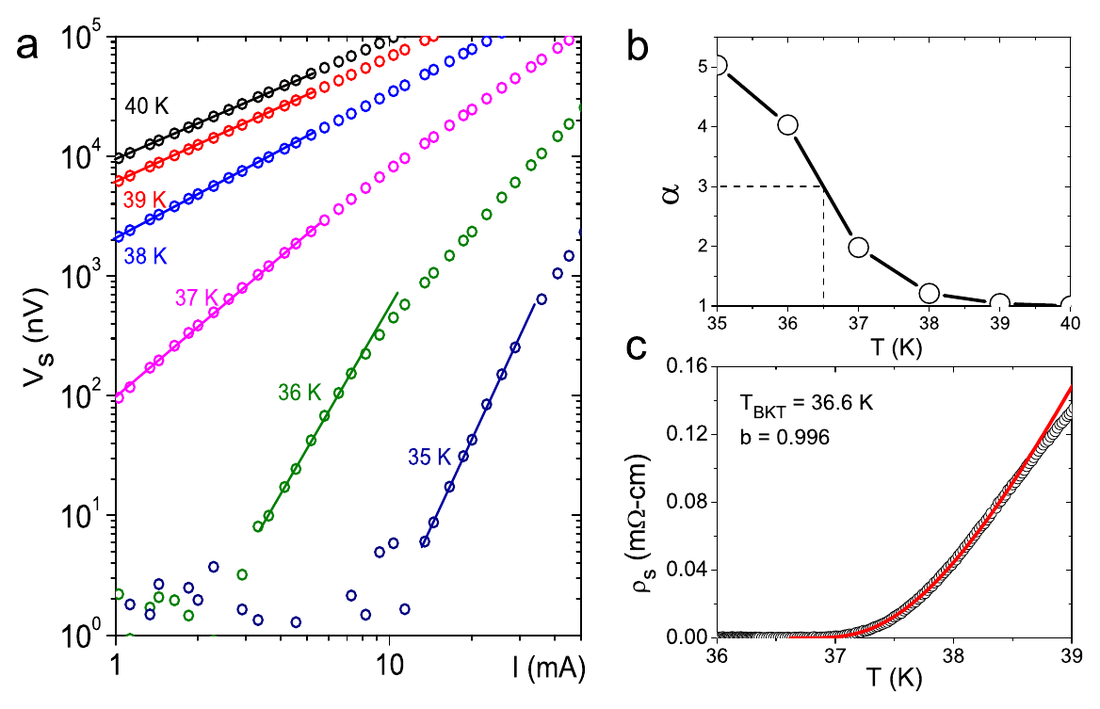
A Berezinskii–Kosterlitz–Thouless test. A thin superconducting sheet does not lose resistance the way a bulk crystal does. In two dimensions the transition is driven by vortex–antivortex pairs that unbind above TBKT, and theory makes two sharp predictions near it: the voltage follows V ∝ Iα with the exponent reaching α = 3 at TBKT, and the resistance follows ρ ∝ exp(−b/t), with t = T/TBKT − 1.
I measured I-V curves on the surface contacts and the bulk contacts separately. Both fit the BKT form, but with very different parameters: TBKT = 36.6 K, b ≈ 1.0 at the surface against 21.5 K, b ≈ 3.3 in the bulk. Two distinct two-dimensional transitions in one crystal.
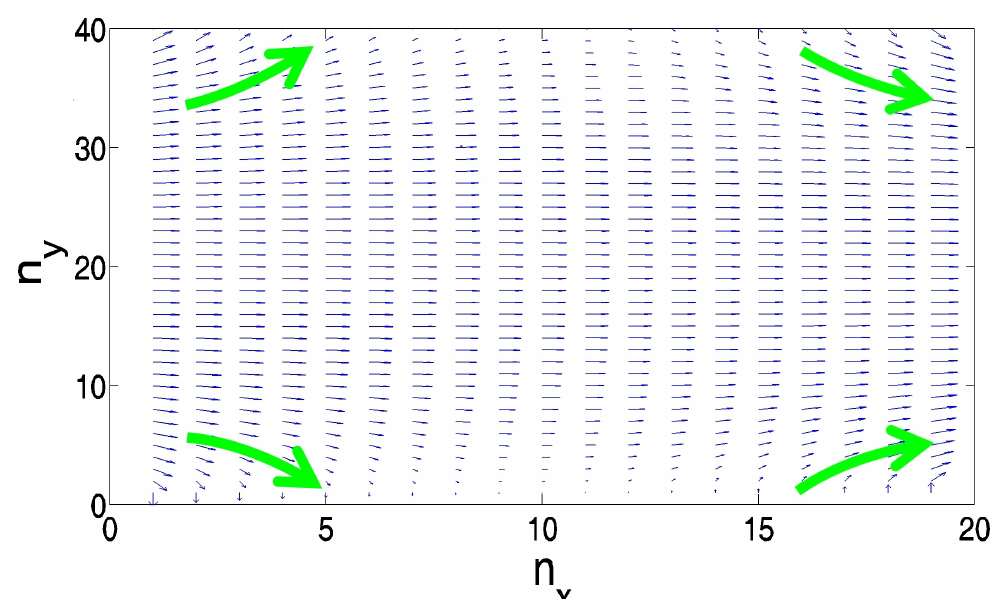
Why the surface does not short out the bulk. If the surface becomes a superconductor at 36 K, why does the crystal still show resistance down to 22 K? I answered that with a model. Current in an anisotropic conductor obeys
σab ∂²φ/∂x² + σc ∂²φ/∂y² = 0
Rescaling y by √(σab/σc) turns it into an ordinary Laplace equation, which I discretised into a resistor mesh of up to 200 × 3,400 sites with a near-zero-resistance surface row, and solved with Kirchhoff's laws. Because the c-axis resistance of these layered crystals is so high, the superconducting surface captured less than 2.5% of the current. The bulk stays resistive underneath it, exactly as measured.
What could cause it. Chemical inhomogeneity, oxygen loss and contact artefacts were each tested and ruled out. The leading explanation is structural: the surface is where the crystal ends, so the LTT distortion that pins stripes may not form there. Free to fluctuate, the stripes may then help superconductivity instead of suppressing it, which is consistent with the effect appearing only where stripe order exists.
4.4 · Stripes and fluctuations
Listening to Cooper pairs above Tc with the Nernst effect.
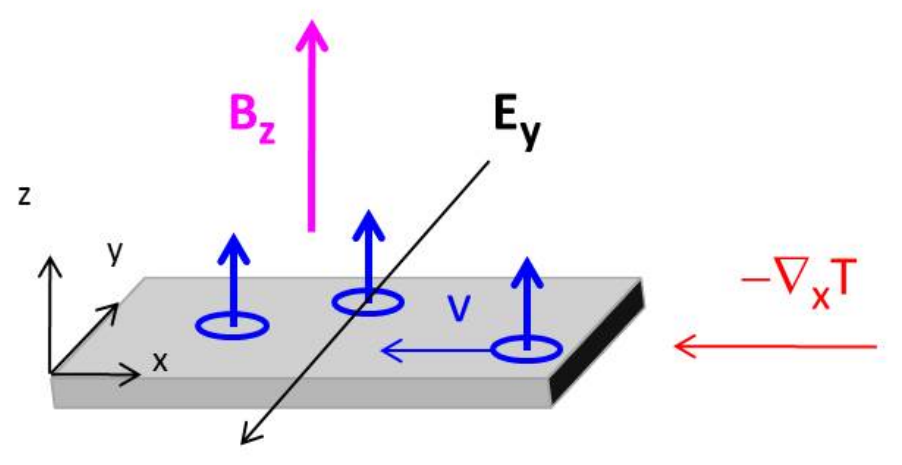
Put a temperature gradient along a sample and a magnetic field through it, and a small voltage appears across it: the Nernst effect. In ordinary metals it is tiny. In superconductors it becomes large, because two things carry entropy down the gradient and are deflected sideways: moving vortices, and short-lived Cooper pairs that form and break up above Tc.
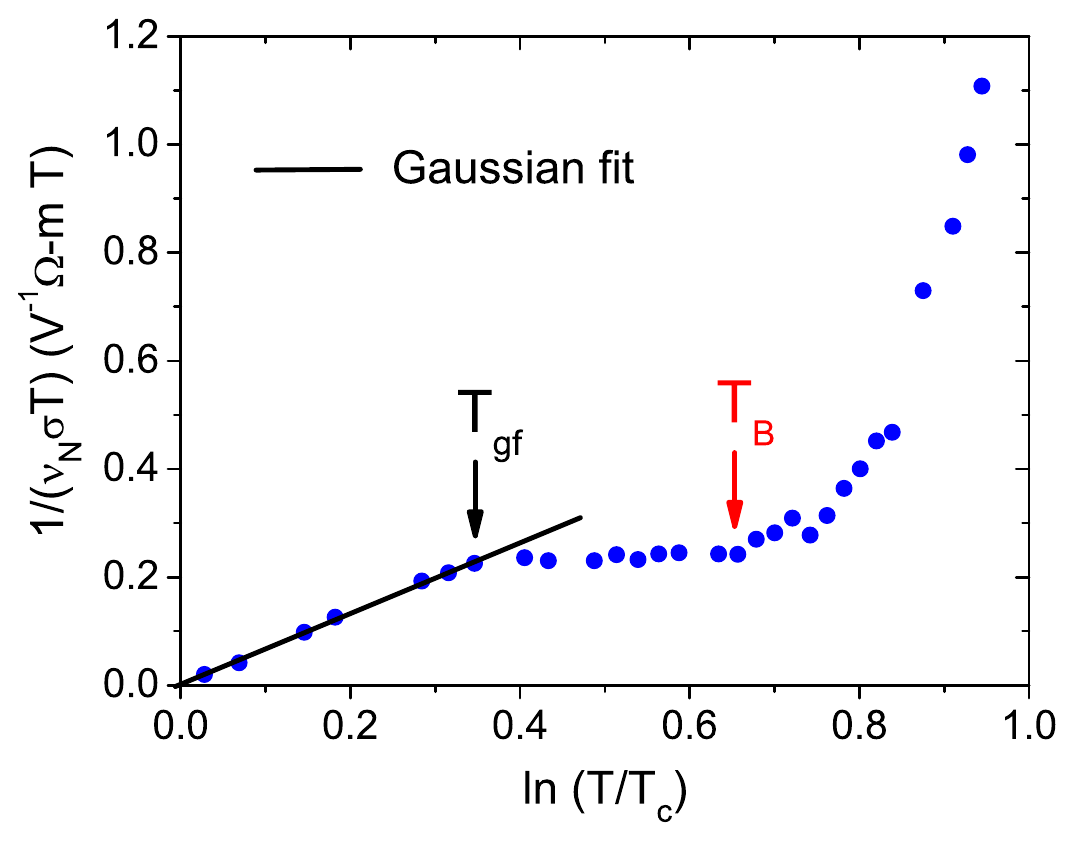
The Ussishkin–Sondhi–Huse theory of Gaussian fluctuations gives a clean test for the second. Near Tc the transverse Peltier coefficient αxy = νNσ should follow
αxy ∝ 1 / [T ln(T/Tc)]
so a plot of 1/(νNσT) against ln(T/Tc) is a straight line wherever Gaussian fluctuations rule.
My Nernst data on LBCO-0.12, taken in both field directions so that only the field-antisymmetric part remained, followed that line from Tgf = 33 K down, using Tc = 23.3 K. Several features did not fit a simple picture:
- a second Nernst peak starting at the structural transition, Td = 51 K, linked to quasiparticles in the LTT phase
- a non-Gaussian fluctuation regime between Tgf = 33 K and TB = 45 K, consistent with superconducting stripes that are not phase-locked to one another
- a Nernst signal at zero applied field, peaking at the charge-stripe ordering temperature Tco = 47 K, which points to spontaneous magnetism or chiral stacking of stripes that breaks mirror symmetry
4.5 · From result to IP
A lab finding with a practical use.
The discovery suggested a simple way to make a superconducting surface layer. You remove the surface of a suitable crystal, for example by grinding, cleaving, cutting or etching, and expose a fresh face. That could be easier than depositing a thin film, which is costly and hard to reproduce. Possible uses include superconducting electronics such as Josephson elements, sensitive magnetic sensors and band-pass filters.
I'm a co-inventor on the resulting patent, together with researchers at AIST and my supervisor. It is owned jointly by AIST and NTU.
- TitleSurface layer superconductor and fabrication method of the same
- Singapore patent11201510509W
- International publicationWO 2014/207946
- Filed · Granted28 Jun 2013 · 25 Oct 2016
Why it matters to you
What this work says about how I'd work for you.
I find and kill noise
The same habits matter in metrology, test engineering, sensors and any measurement where a small signal hides in a large background.
I design, build and iterate
I took one probe from CAD through machining, assembly and four revisions. That's the same loop as product development.
I challenge my own results
I checked a surprising result in several independent ways before claiming it. I'd bring that discipline to root-cause and failure analysis.
I work across organisations
I worked with crystal growers in Japan, theorists in China and the US, and an undergraduate team. The project ended in a jointly owned patent.